Solar Project Overview
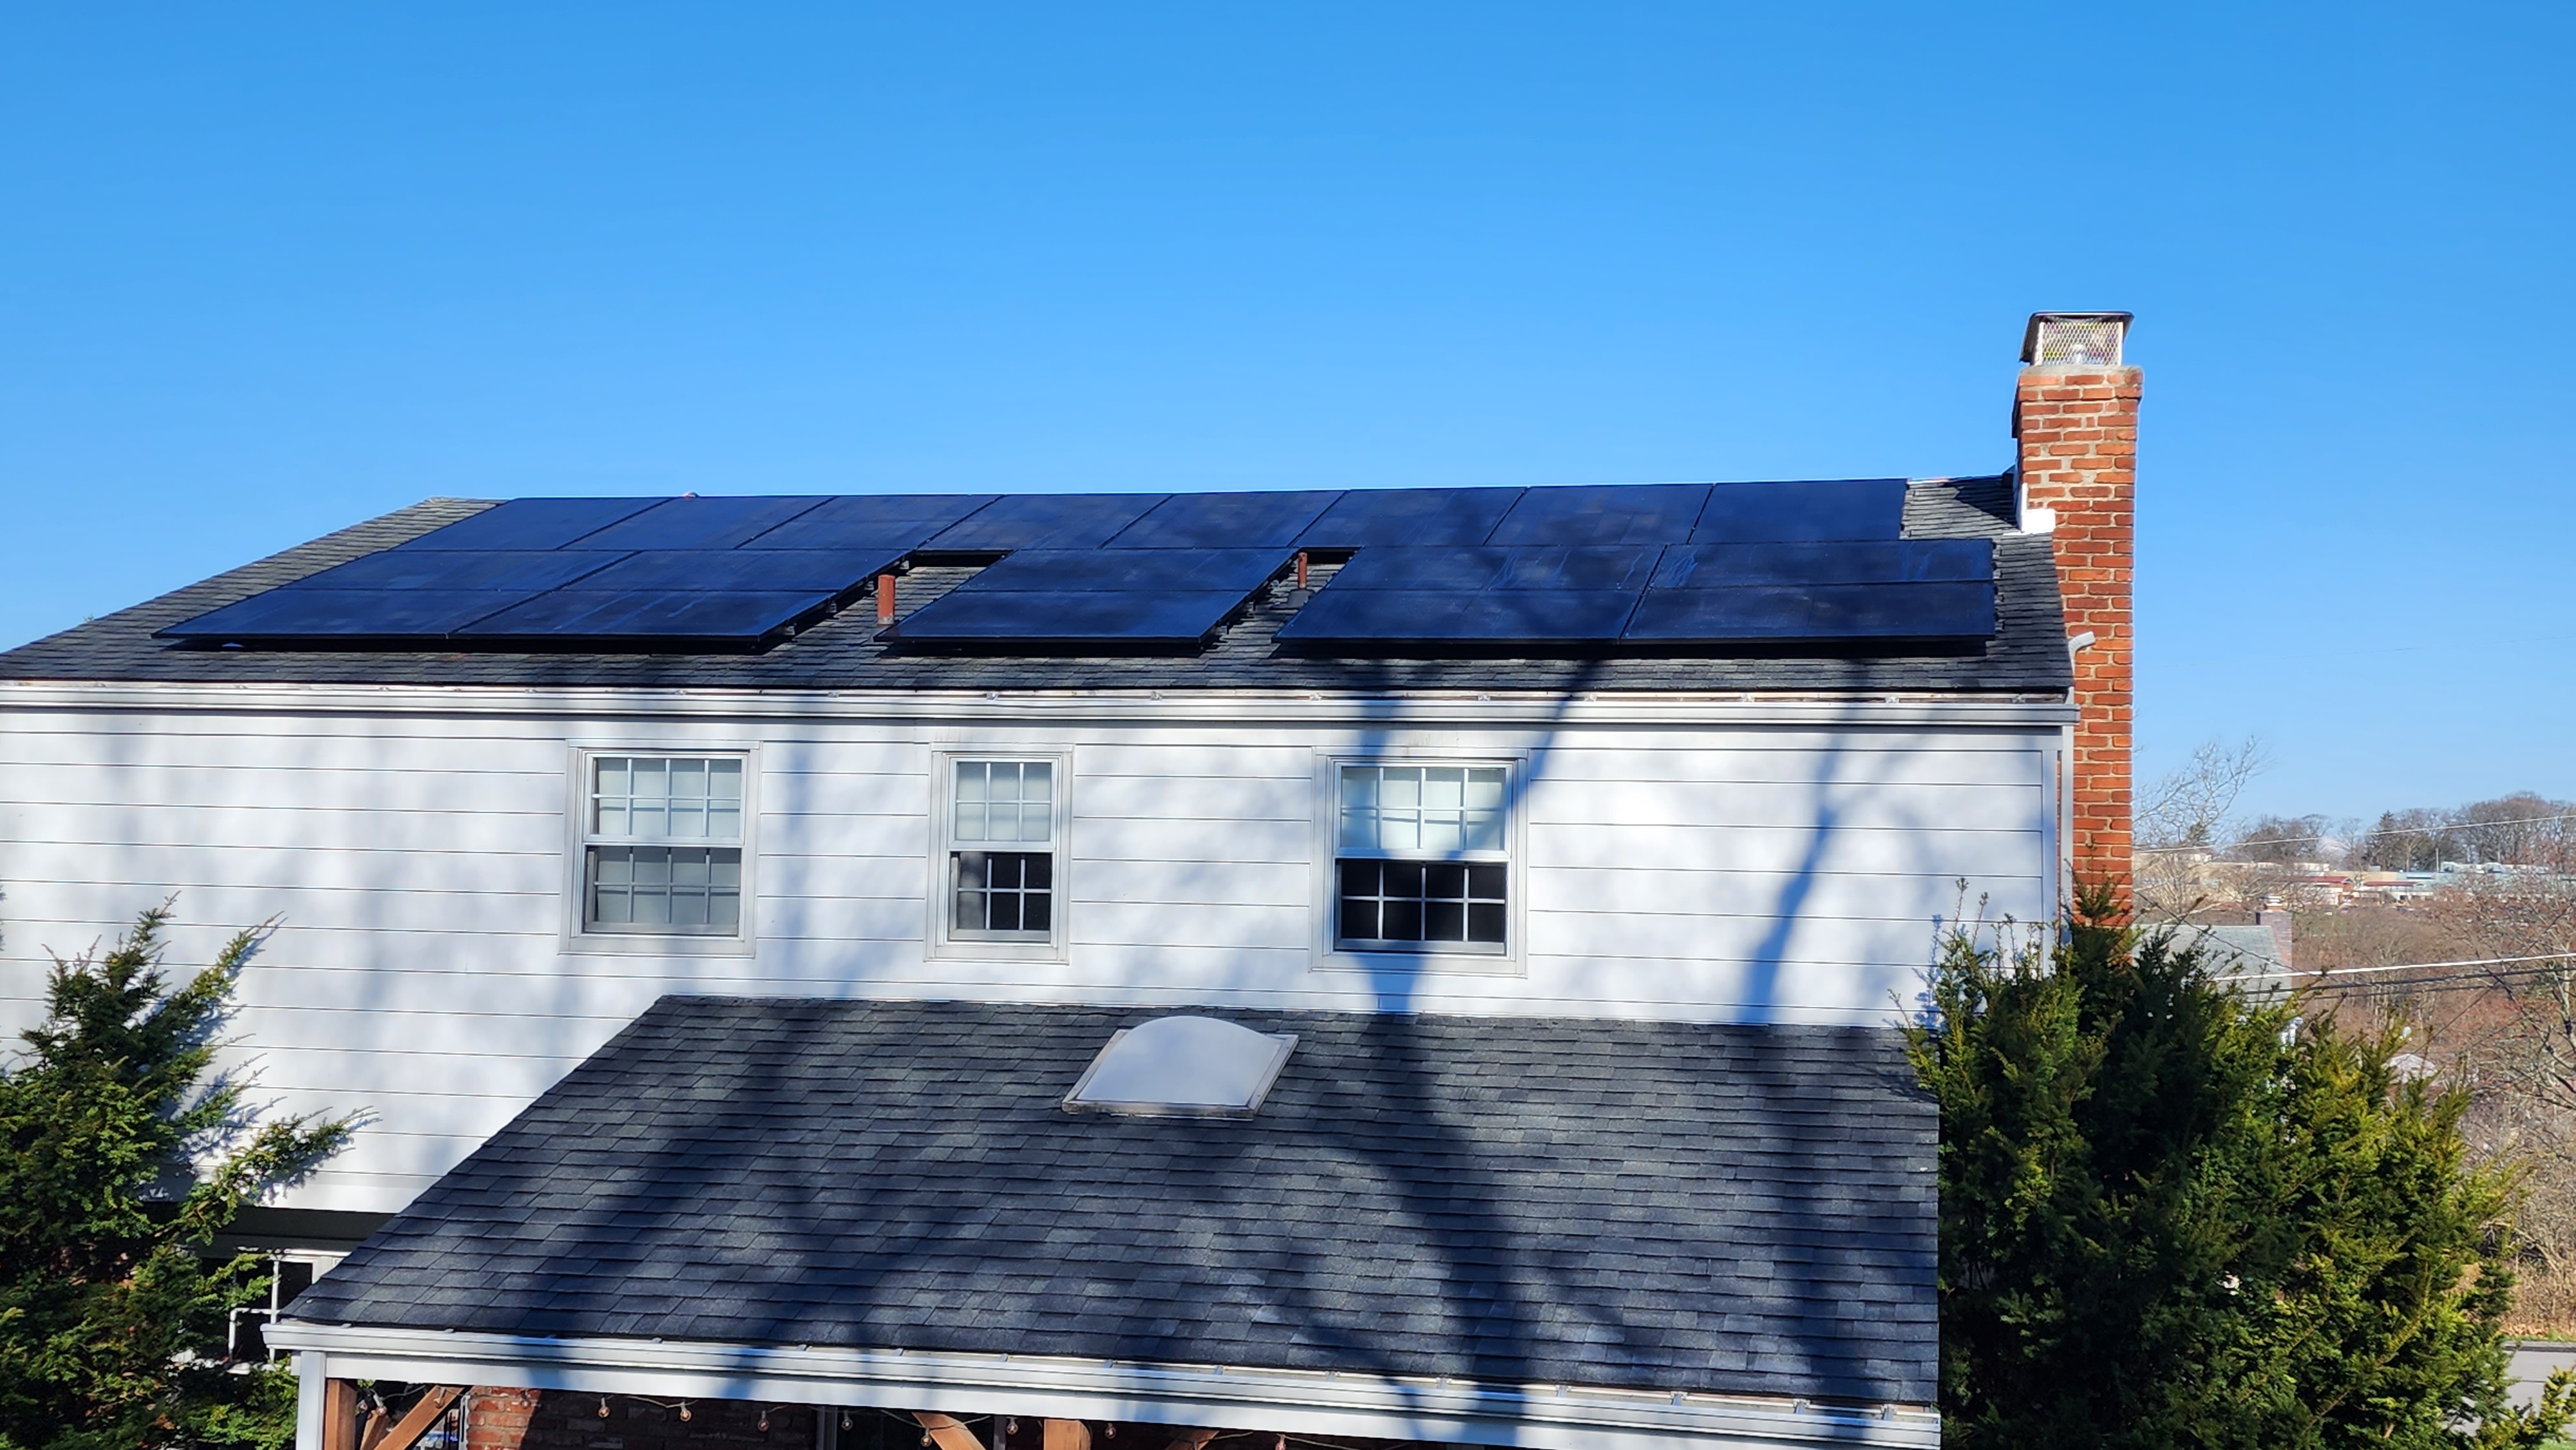
In early 2023, we had 22 solar panels installed on our roof. The VERY first thing I asked our Palmetto rep when we received permission to operate was, "Okay, this owns, but how do I get data from these guys?" He directed me to their proprietary Palmetto app, which would give hour-by-hour counts of kilowatt-hours produced. This would not sate my obsessive need for data! Not only was this not a live feed, but I was also unable to find a way to scrape this data. Super unfortunate for a data dork like me!
For months, I tried to find another option. The best I could come across was begging Palmetto customer service to give me access to more detailed data. This... did not work, so I decided to look into the source. Our inverter is from SolarEdge, and it turns out that they have a tracking app, too. I installed it and... couldn't connect to the inverter. Once again, I had to call Palmetto customer support and beg for access. Somehow, this worked! I was finally allowed to access the SolarEdge monitoring app and the precious data contained within.
Of course, the immediate question after getting access to data is always, "Now how do I download this data?" Fortunately, SolarEdge has a website and API that were pretty easy to find and use. To gain experience with Python, I wrote some code to directly pull hourly data from their API site. This then made me wonder, how could I work my statistical knowledge on this? Can I gather OTHER kinds of data to see what effect they have on production? Thinking about it, the main factors that determined production were likely weather, temperature, hour, and time of year. Weather and temperature could be scraped using OpenWeather's API, which I created another Python script for. Hour and time of year were a given from both datasets, but I eventually came to realize that they weren't specific enough. Since solar relies on, y'know, the SUN, I figured there HAD to be a way to find the sun's position in relation to my panels.
And ohhhhh buddy, does that data exist! It took months of searching the internet and testing Python packages, but I FINALLY found functions that got what I needed. At the same time, I realized that there HAD to be a preexisting formula to determine maximum production given the sun's position. It took even MORE months of searching, but I eventually found it. Everything was coming up Timko! I assembled all of the datasets and combined them into a singular source, then imported them into R for statistical analysis (As much as I wanted to learn how to do this in Python, my deeper experience in R drew me back home). Everything looked great, and I had all of the data I could ever need!
...But I didn't really know what to DO with it. Truthfully, I'm still kind of in this position. Eventually, I'm going to want to expand my array as I further electrify my house (more on that MUCH later), so I can use predictive statistics to see how many we would need to acquire. They would have to go on the front side of our roof, which I DID find produces less than the back side thanks to that formula, so there's some work I could do there. I'd also like to do some regressions to figure out the factors that have the greatest effect on production. I've tried some preliminary ones, but they resulted in absurdly high p-values as I whittled the factors down. Definitely something to look more into, though.
So, this site is going to be for figure this all out! In future posts, I'll further detail my Python and R code to show what all I've done and what more there is to do. I've also mentioned my intention to electrify my house, and I expect to make some posts on that process, too. Should be some interesting dives into energy use from gas vs. electric there!